No products in the cart.
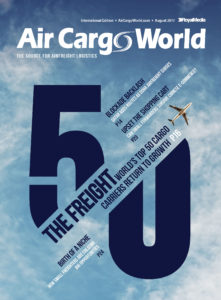
The Freight 50: The world’s top carriers return to cargo growth
 In an industry as cyclical as the airfreight sector, good news is usually followed by a period of mild trepidation. “If demand is up one month, surely it will fall the next months,” goes the general wisdom of veteran air carrier executives who know how the airfreight rollercoaster works. So, after the bump in airfreight traffic last summer due to the Hanjin bankruptcy, followed by an unusually strong peak season in late 2016, most carriers and forwarders braced for the impact of the winter doldrums that tend to negate the happy feelings of the holiday shopping season.
This year, however, something strange happened. The air cargo growth just kept going. And going. It’s still going today.
While some pessimists feel the demand will inevitably fall at some point during the summer, most carriers said they expect the growth to continue into the coming peak season. As can be seen in this year’s Freight 50 list, the period of growth that began in 2016 had a generally positive effect on the overall year (see Top 50 chart). Industrywide, IATA said, freight tonne kilometers (FTKs) grew by 3.6 percent in 2016, nearly double the 2 percent average annual increase experienced over the previous five-year period.
The fifty airlines and airline groups that are included in this listing carry nearly 96 percent of the world’s cargo traffic. While there is no single, definitive source of carrier data to cover the entire air cargo business, Air Cargo World considers this Freight 50 listing to be the most comprehensive report in the business – based on information from IATA’s latest “World Air Transport Statistics” (WATS) report, the U.S. Department of Transportation (DOT), the extensive database maintained by our sister publication, Cargo Facts, and from statistics supplied by more than 200 carriers.


